Method 101: Diagramming as Theorizing
Yrjö Engeström is a Professor of Adult Education and Director of the Center for Research on Activity, Development, and Learning (CRADLE) at the University of Helsinki and Professor Emeritus of Communication at the University of California, San Diego.
Yrjö Engeström was drawn to the Soviet-Russian tradition of Cultural-Historical Activity Theory as a university student and activist, beginning his first activity-theoretical study in 1982. To avoid curricular constraints in school settings, he chose the world of work and organizations as his field of study, where he encountered a more open attitude toward novel ideas and practices (Engeström & Glaveanu, 2012, p.515).
This starting point anchored his research trajectory and led to a series of major innovations, including the Activity System, Expansive Learning, and Developmental Work Research.
In 1987, he published his seminal work Learning by Expanding (1987/2014), in which he introduced the now-famous Activity System triangle, the concept and model of Expansive Learning, and the early formulation of the Developmental Work Research methodology. Since then, his research has greatly deepened our understanding of development and learning across diverse work settings and made major contributions to Cultural-Historical Activity Theory.
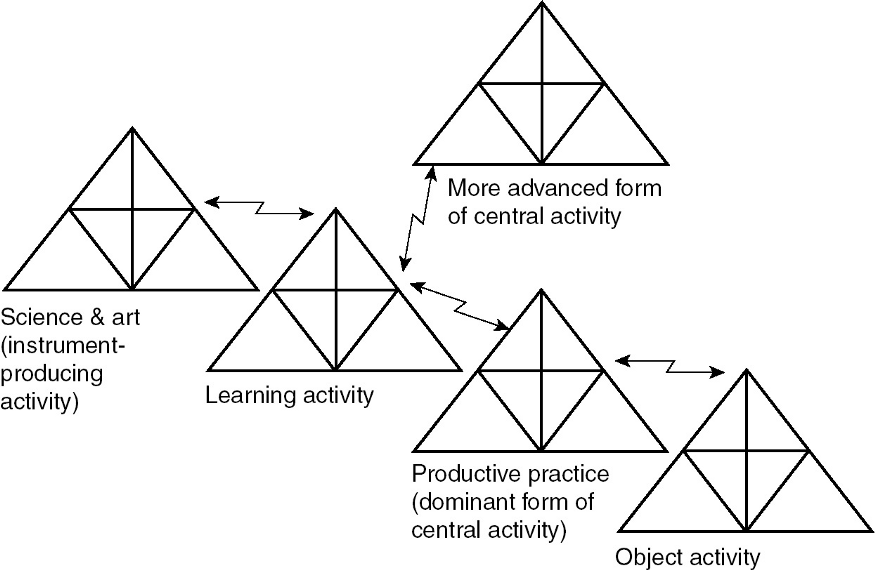
One of the major outcomes of Learning by Expanding is a diagram that aims to picture Leontiev’s activity system. Now the diagram has a nickname called “Engeström’s Triangle”.
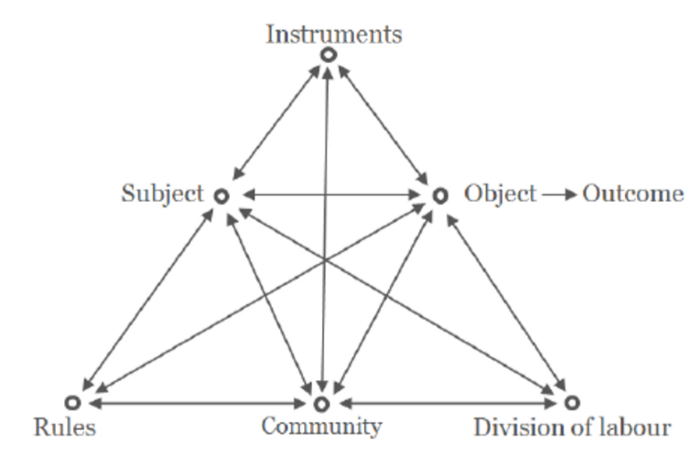
The Engeström’s Triangle builds on the cultural-historical psychologists’ notion of mediation, represented in the upper part of the diagram as the triad of subject–instrument–object describing individual action. Engeström (1987) considered “a human activity system always contains the subsystems of production, distribution, exchange, and consumption.” (p.67). To account for these collective aspects, he expanded the original triangle by adding the lower layer, which includes community, rules, and division of labor.
Some authors regard this diagram as a graphical heuristic. For example, Geri Gay and Helene Hembrooke (2004) wrote, “…Building on these principles, Alexei N. Leont’ev (1981) created a formal structure for operationalizing the activity system as a complex, multilayered unit of analysis (figure 1.1). His model is less a representation of reality than a heuristic aid for identifying and exploring the multiple contextual factors that shape or mediate any goal-directed, tool-mediated human activity.” (p.2).
Similarly, Clay Spinuzzi (2020) described Engeström’s model as a graphic heuristic, “…Engeström provided a graphical heuristic (the now-famous triangle) for picturing Leontiev’s activity system. This heuristic, which has been derided by some critics (e.g., Miller, 2011)…”.
However, Spinuzzi also emphasized the model’s practical and communicative value, “This heuristic…was meant not only as an analytical device for researchers but (critically) also as a way to communicate with — and codesign work with — research participants (e.g., Engeström, 1999; Engeström & Sannino 2010). That is, it served as an interventionist ‘language game’ (Ehn 1989) similar to the prototypes and organizational games that Bødker and other participatory designers used to leverage the tacit expertise of participants. This point has been overlooked by those who have critiqued the triangle heuristic as an oversimplified theoretical tool.”
Engeström regarded the use of graphic models as an essential component of his theory-building method. He wrote, “There are further two specific features of presenting and processing data in this book. The first one is the extensive use of quotations from the theoretical sources discussed and analyzed. The second one is the almost equally extensive use of graphic models.”
He viewed graphic models as both representations and instruments, inviting readers to construct their own versions of the diagrams. As he explained, “My extensive use of graphic models serves a twofold purpose. For the first thing, it aims at making the central categories found transparent and compact. This is the representation function of the models. But I use the graphic models in a series of successive variations, not just as singular representations. The series of successive variations serve the instrumental or processual function of the models. With the help of such variations, I try to demonstrate how the models can depict movement and change. The reader is invited to formulate and test his own variations.” (1987, p.47)
How many diagrams did he use in Chapter 2 of Learning by Expanding?
The answer is not one — it is twelve.
Engeström deeply understood the power of both the diagram and the act of diagramming. In this discussion, I use the noun diagram to refer to what Engeström called the “representational function” of models, and the gerund diagramming to refer to their “instrumental or processual function.”
The representational function is static, permanent, and bounded, while the instrumental function is dynamic, temporary, and open-ended. From the perspective of Activity Theory, a diagram can be viewed as an instrument of knowing and understanding.
Vygotsky distinguished between two types of instruments in human activity: tools and signs, the latter often referred to as “psychological tools.” He wrote, “The following can serve as examples of psychological tools and their complex systems: language; various systems for counting; mnemonic techniques; algebraic symbol systems; works of art; writing; schemes, diagrams, maps, and mechanical drawings; all sorts of conventional signs; etc.” (Vygotsky 1981, p.137, cited in Engeström, 1987)
Clay Spinuzzi (2020) reviewed the critiques of Engeström’s triangle and offered a balanced assessment: “Engeström provided a graphical heuristic (the now-famous triangle) for picturing Leontiev’s activity system. This heuristic, which has been derided by some critics (e.g., Miller, 2011), was meant not only as an analytical device for researchers but (critically) also as a way to communicate with — and codesign work with — research participants (e.g., Engeström, 1999; Engeström & Sannino 2010). That is, it served as an interventionist ‘language game” (Ehn 1989) similar to the prototypes and organizational games that Bødker and other participatory designers used to leverage the tacit expertise of participants. This point has been overlooked by those who have critiqued the triangle heuristic as an oversimplified theoretical tool. (See Sannino 2011 for further elaboration of this point, and see Engeström 2018, pp.23 and 78 for other representations Engeström has developed for local stakeholders.)”
As Engeström himself noted, “I use the graphic models in series of successive variations, not just as singular representations…With the help of such variations, I try to demonstrate how the models can depict movement and change. The reader is invited to formulate and test his own variations.” (1987, p.47)
Thus, we should remember that the diagram is not a dogma but a guide to action.
When we think about thinking, we often assume we are thinking in words. However, linguistic thought is not the only mode of the human mind. Cognitive scientist Barbara Tversky argued that spatial thought forms the foundation of abstract reasoning in her 2019 book Mind in Motion: How Action Shapes Thought.
I want to highlight three ideas I learned from Barbara Tversky. The first is about taxonomy and partonomy, the second is individual differences in mental rotation, and the third is a story about the Feynman diagram.
First, Tversky observed, “Spatial hierarchies are partonomies, not taxonomies like the categories of objects, events, and scenes…Partonomies are hierarchies of parts; taxonomies are hierarchies of kinds…categories allow reducing the amount of information in the world…Like taxonomies, partonomies allow inferences, but inferences of containment, not of properties…” (Tversky, 2019, pp. 77–78)”
According to Tversky, “Mental rotation is a distinctly visual-spatial transformation. It has been likened to watching something actually rotate in space…mental rotation task has become one of the major measures of spatial ability.” (p.89–90) She also pointed out the individual differences in mental rotation, “Surgeons, plumbers, electricians, football coaches, mathematicians, fashion designers, urban planners, gardeners, physicists, fire fighters, architects, basketball players, interior designers, dentists, and so many more use mental rotation and other forms of spatial reasoning regularly in their work…lawyers and journalists and historians and accountants and executives and philosophers and poets and translators don’t seem to need mental rotation in their work.” (p.91)
In Chapter 8, titled “Spaces We Create: Maps, Diagrams, Sketches, Explanations, Comics,” Tversky directly discussed the cognitive role of diagrams: “The ease of reasoning from well-designed diagrams has encouraged new fields to blossom, endeavors to make mathematics, logic, physics, and computer science diagrammatic, yet rigorous, in order to capitalize on our extraordinary abilities to see spatial relations and to reason about them. The rationale is the same, that diagrams use the power of spatial-motor reasoning for abstract reasoning.” (2019, p.210)

She also shared a compelling story about the Feynman diagram: “Mark Wexler, now a cognitive scientist working on perception and mental imagery, used to be a physicist. When he was a physicist, he was working with the Feynman diagram in Figure 8.8. Each gray blob represents a separate universe. For the universe to be coordinated, the twist in the lower blob had to be undone. He imagined grabbing each of the lower ellipses with his thumb and index finger and twisting them in opposite directions, a bit like Cat’s Cradle. Doing that made him realize that untwisting the lower one twists the upper. The only way to remove the twist is to cut one of the attachments. This conclusion has implications for spacetime and quantum gravity, but that’s beyond me and thankfully beyond the scope of the book. His intuition turned out to be right, as he later showed in a rigorous line-by-line proof. Feynman diagrams are admittedly abstrute, as is the physics they represent, but once they are learned, like all effective visual spatial representations, they become a powerful thinking tool.” (p.211)
The goal of Activity Theory is to understand various types of human activities in the real world. Engeström’s intended audience includes both researchers and practitioners. The value of learning Activity Theory lies not merely in acquiring its concepts and ideas but in enabling real transformations in practice through the use of its concepts, models, and methods.
I argue that Engeström’s triangle and his graphical approach to theory building represent a compelling case of diagramming as theorizing.
Since Tversky formulated the sixth law of cognition — that “spatial thinking is the foundation of abstract thought” (p. 72) — we should rethink how theory is developed and knowledge is constructed.
It is time to move from language-based theorizing to spatial thinking-based theorizing.
Diagrams and diagramming provide powerful means for visualizing complex structural relationships such as activity and other social phenomena.