The Tripartness Meta-Diagram and Diagram Blending

Meta-diagram and Diagram Network
by Oliver Ding
This article introduces a meta-diagram called Tripartness. It is one among several meta-diagrams I have developed over the past years. The Tripartness meta-diagram can be expanded into what I call a Diagram Network — or, put differently, it can be seen as the result of a process of Diagram Blending.
Originally written on July 30, 2021; updated on November 14, 2025
I created the Tripartness meta-diagram in 2018, when I developed the Ecological Zone Framework.
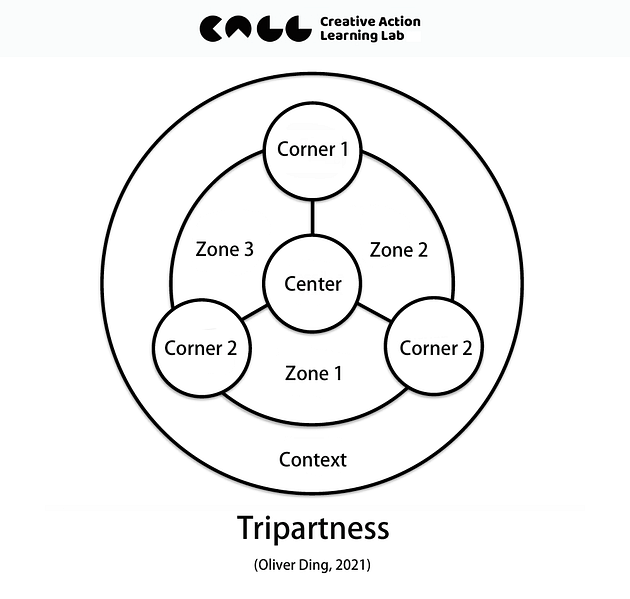
The Tripartness diagram has two pairs of concepts:
- Corner and Zone
- Center and Context
To understand these concepts, we can use three diagrams:
- Corner: The Dialectic Room
- Zone: The Interactive Zone
- Center and Context: The Hierarchical Loops
As shown in the diagram below, the Tripartness meta-diagram can be understood as the outcome of a Diagram Blending process.
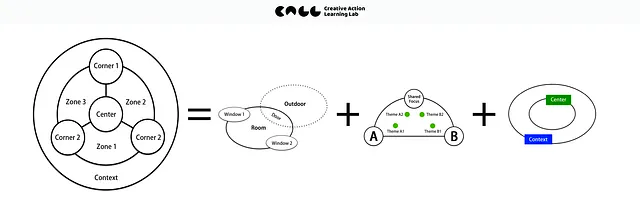
The three contributing diagrams are also meta-diagrams.
In this article, we will explore the concepts of meta-diagram and Diagram Blending through the case study of the Tripartness meta-diagram.
Meta-diagrams Really Matter
I have mentioned an idea called Avocado Effect, which describes a basic structure: “meta-product / product.” If we apply the Avocado Effect to diagramming, we see the same structure: “meta-diagram / diagram.”
Diagrams are one of my three essential knowledge units. I love thinking through diagramming. In 2018, I even wrote a 108-page thesis that developed a theory about diagrams and diagramming. This theory includes two groups of ideas. The first group is “meta-diagram, diagram, and diagram system.” The second group is “diagramming as an activity of knowing, theorizing, and reflecting.”
The idea of a “meta-diagram” treats a certain kind of diagram as something independent. It does not need to represent an existing theory or model. For example, the 2×2 matrix is a meta-diagram. It does not point to any specific model, such as the BCG Growth-share matrix. A diagram system is a set of diagrams that share an internal spatial logic and a common visual identity.
The idea of “diagramming as an activity of knowing, theorizing, and reflecting” takes a process view. In this view, a diagram is always becoming. We can use diagrams as tools for thinking. They do not have to be final outcomes.
I have discussed this topic in a previous article: Activity U (IV): The Engeström’s Triangle and the Power of Diagram. If you want to go deeper, you can read the following sections:
- 5.1 Diagram (Representation) vs. Diagramming (Instrument)
- 5.2 Spatial thought vs. Linguistic thought
- 5.3 Knowledge model vs. Knowledge brand
As Engeström wrote, “I use the graphic models in series of successive variations, not just as singular representations…With the help of such variations, I try to demonstrate how the models can depict movement and change. The reader is invited to formulate and test his own variations.” (1987, p.47)
We should remember that a diagram is not a dogma. It is a guide for action.
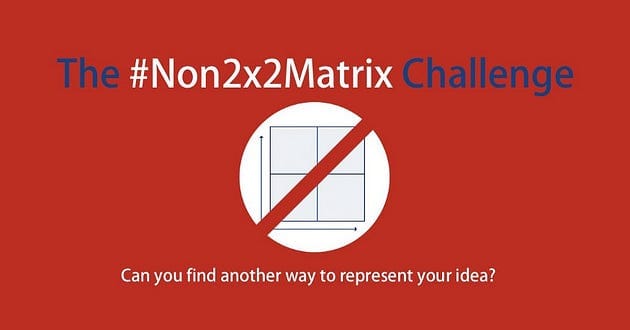
The #Non2x2Matrix Challenge
Last year (2020), I started a challenge called #Non2x2Matrix.
In 2018, I wrote a 108-page personal thesis about diagrams and diagramming. I found that many management and business thinkers like to use a 2×2 matrix to represent their ideas. And it is really bad.
In November 2019, I read a paper titled "The Technology-Mindset Interactions: Leading to Incremental, Radical, or Revolutionary Innovations." The authors used a 2×2 matrix to create three types of innovation models. I think this matrix is too simple because it only considers two dimensions: technological transformation and mindset transformation. I want to add a third dimension: culture transformation.
This reading experience inspired me to initiate the #Non2x2Matrix Challenge, encouraging people to use something beyond the 2x2 Matrix.
Why do we use the 2x2 Matrix? Because we need a visual frame to represent our ideas. But if we always use the 2×2 matrix, it becomes a cage for our mind. Meta-diagrams really matter. We need more choices of meta-diagrams.
What really limits our thinking is not the labels we put into the matrix, but the intrinsic spatial logic behind it. A diagram system always carries its own built-in way of organizing space. This logic is not something we add later. It is part of the structure of the diagram itself. It decides where things go, how they relate to each other, and how the whole diagram works as a thinking tool.
Take the 2×2 matrix as an example. Its intrinsic spatial logic is simple: four equal quadrants formed by two axes. Any diagram that keeps this logic belongs to the same diagram family, no matter what content we place inside. The labels change, but the spatial logic stays the same. This is why all 2×2 matrices feel similar, even when they talk about different topics.
If we keep using the same intrinsic spatial logic, we keep thinking in the same way. To break out of this pattern, we need to explore more types of intrinsic spatial logic. Only then can we open new ways of seeing, comparing, and creating ideas.
In the following sections, a new meta-diagram, Tripartness, is introduced as an example of a new intrinsic spatial logic. We will see how a single new meta-diagram can expand our thinking. Moreover, it shows how several meta-diagrams can work together, demonstrating the power of a Diagram Network, beyond the single-diagram pattern.
The Tripartness Meta-Diagram
I created the Tripartness meta-diagram in 2018, when I developed the Ecological Zone Framework.

The original Ecological Zone Framework considers three Subjects, three Zones, and one shared Theme. To turn it into a meta-diagram, I renamed these elements with more abstract words: Corner, Zone, Center, and Context.
In practice, you don’t really need these words to create new diagrams. But I wanted to share the diagram with readers and connect it with other diagrams, so words are necessary for communication.
Creating a new diagram with the Tripartness meta-diagram is simple. You just replace Corner, Zone, Center, and Context with your own terms. For example, I recently used it to curate my three theoretical accounts. See the diagram below:
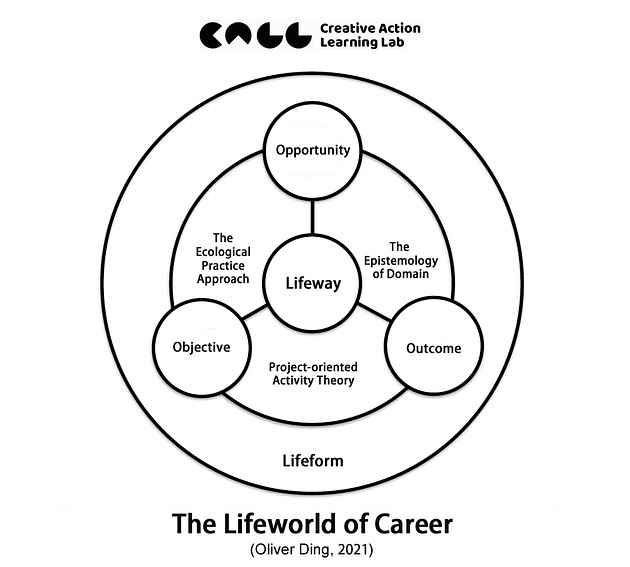
On July 4, 2021, I finished a 64-page thesis titled The Epistemology of Domain, which presents a new theory about Domain. The next day, I sent a draft to a friend and summarized my three major theoretical creations with three keywords:
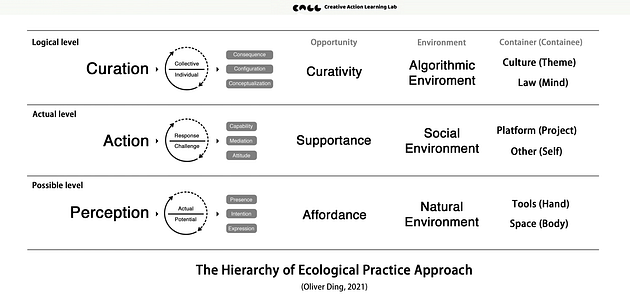
- Opportunity: The Ecological Practice Approach
- Objective: Project-oriented Activity Theory
- Outcome: The Epistemology of Domain
Later, I used the Tripartness diagram to reorganize these ideas. I also added the pair of concepts Lifeway / Lifeform to the diagram, which led to a new framework for discussing career development.
This eventually led to a new project. I added the new diagram to the Career Curation board and started writing. The first draft in Chinese was 106 pages long. Although this project later stopped, its original ideas show the unique value of Tripartness as a tool for creative inspiration.
Each Corner is a Dialectic Room
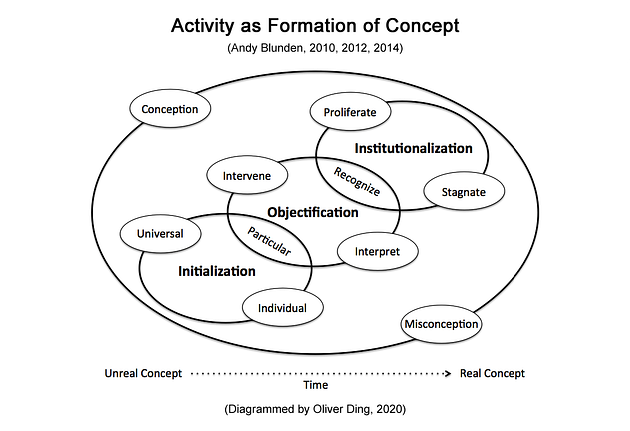
On January 3, 2021, I published an article titled Activity U (VIIII): Project-oriented Activity Theory, which introduced Andy Blunden’s Project-oriented theoretical approach to activity using a series of diagrams.
I used the diagram below as a meta-diagram for building a diagram system.
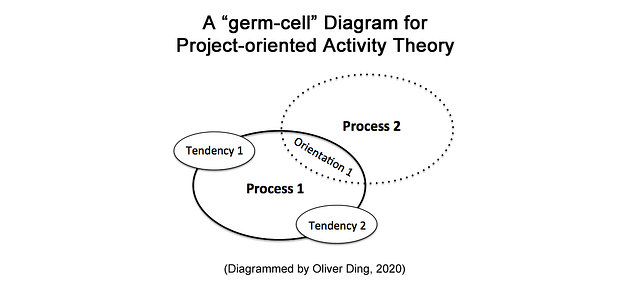
This diagram served as a “germ-cell” diagram for Project-oriented Activity Theory. Later, in 2011, I turned it into a meta-diagram called Dialectic Room.
It is useful to think of this meta-diagram as a room with two windows and one door.
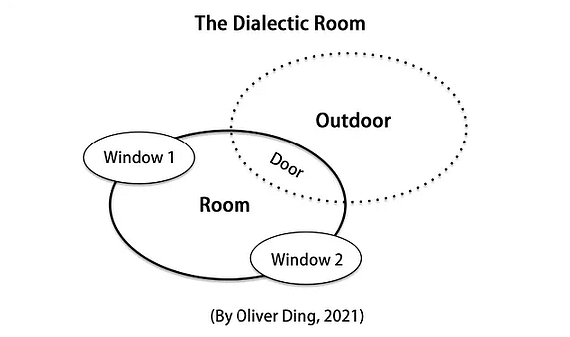
A room is a container that separates the inside space from the outside space. There are several kinds of actions people can perform within a room. Here, I focus on a particular type of action: connecting the inside space to the outside space. Let’s call this action “Process.”
The two windows serve as interfaces that represent two “Tendencies.” Window 1 refers to Tendency 1, while Window 2 refers to Tendency 2. Each window provides its own view of the outside space.
Finally, there is a door that allows people to actually leave the room. The door refers to “Orientation,” which represents the direction of a real action — an act of moving from the inside space to the outside space.
Once you step into the outside space, you can treat it as a new room and repeat the same diagram.
This expresses a special kind of spatial logic. Terms such as “Process,” “Tendency,” and “Orientation” are textual placeholders for describing this logic. From the perspective of my diagram theory, a pure meta-diagram does not require text. For instance, the Yin-Yang symbol, or Taijitu, is a meta-diagram — can you find any text within it? However, we can add textual placeholders to a pure meta-diagram in order to make its structure easier to describe.
Now, let’s connect this with the Tripartness diagram. Each Corner can be understood as a Dialectic Room. For example, the picture below highlights a Corner of the Strategic Value Proposition diagram.
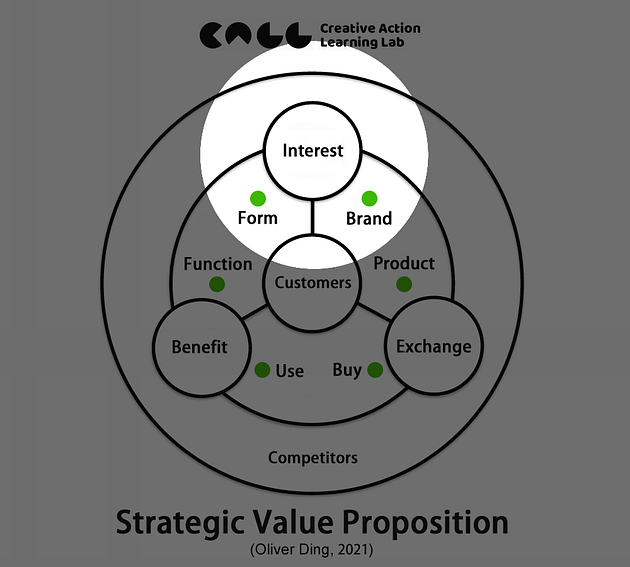
I used the Dialectic Room diagram to create a new diagram for understanding the Interest corner.
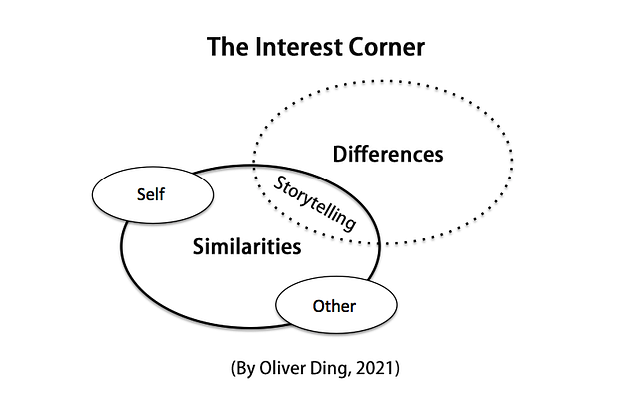
You don’t have to use the Dialectic Room if you prefer other diagrams. Here, I want to emphasize the idea of a Diagram Network. You can take one of my meta-diagrams and use it with other diagrams. By using these diagrams as a network, you can easily organize and curate your loose ideas and knowledge.
The Interactive Zone
As mentioned above, I created the Tripartness meta-diagram in 2018, when I developed the Ecological Zone Framework. The diagrams below show the basic model (left) of the Ecological Zone Framework and its standard model (right).
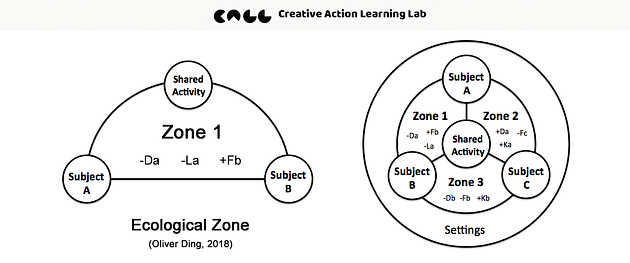
In 2021, I turned the basic model into a meta-diagram with a new name: the Interactive Zone.
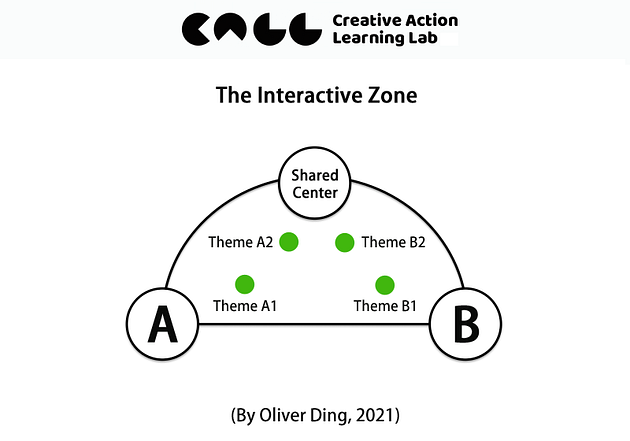
There are many possible themes within an Interactive Zone. Some themes are close to one corner. For example, Theme A1 and Theme A2 are close to Corner A.
We can use the Theme U meta-diagram to discuss themes within an Interactive Zone. The diagram below illustrates the Interest-Exchange Zone. The Theme U diagram uses six themes to connect two containers. The middle container acts as a third container, which is considered a zone.
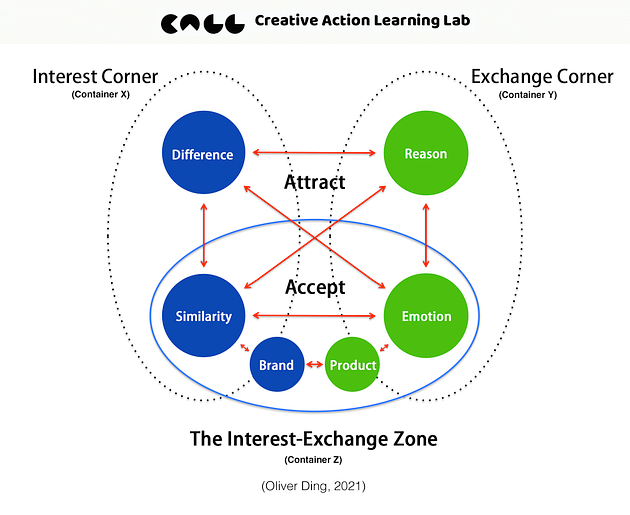
Theme U is also part of the ECHO Way (2.0). You can find more details here, along with two related diagrams: the Project I diagram and the Container Z diagram.
The Hierarchical Loops
I have mentioned an issue about the “Affordance — Supportance” hierarchical loops in a previous article.
It is useful to conduct Affordance Analysis for the Platform-for-Development framework. However, I want to remove Affordance Analysis from the Supportive Cycle model. In order to solve this problem, I need to design a new diagram for visualizing the “Affordance — Supportance” hierarchy loop and placing two level analysis together.
The solution is the following new diagram, which presents two levels: Center and Context. These labels are used only for communication; as a meta-diagram, words are not strictly necessary. You can replace them with concepts that suit your own framework.
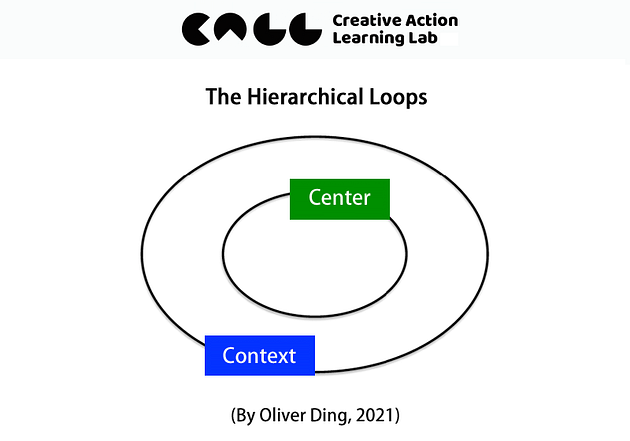
The Hierarchical Loops diagram is composed of two elliptical loops nested within each other. These loops visually represent two complementary spatial logics. The nesting symbolizes the part–whole relationship: each loop is simultaneously an independent layer and a component of a larger whole. At the same time, the diagram also captures the part–part relationship, showing that the layers themselves are not homogeneous but consist of interacting subcomponents that maintain their own internal structure within the broader system.
Each of the two levels maintains its own dynamic interactions. The inner loop and the outer loop are not static; they continuously influence and respond to each other. Changes in one layer feed back into the other, creating a recursive and self-referential system. This dual-level interaction allows Hierarchical Loops to model both the hierarchical embedding of layers and the relational dynamics within each layer, capturing the complex interplay between independence and interdependence in a system.
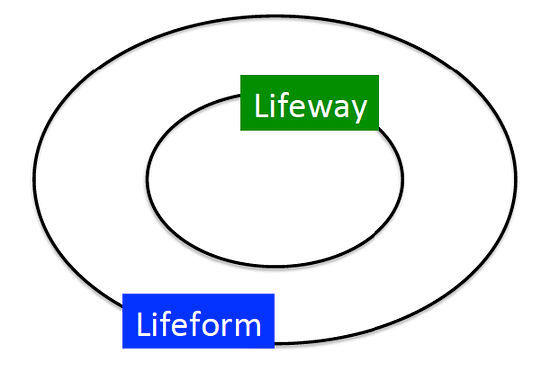
Using the meta-diagram is very straightforward: all you need to do is choose terms to replace Center and Context. For example, I used the pair of concepts Lifeway / Lifeform to represent Center and Context.
The diagram above is primarily useful at the theoretical level. I also expanded it by adopting the pair of concepts Subject — Object from Activity Theory and Enter — Exit from the Ecological Practice Approach.
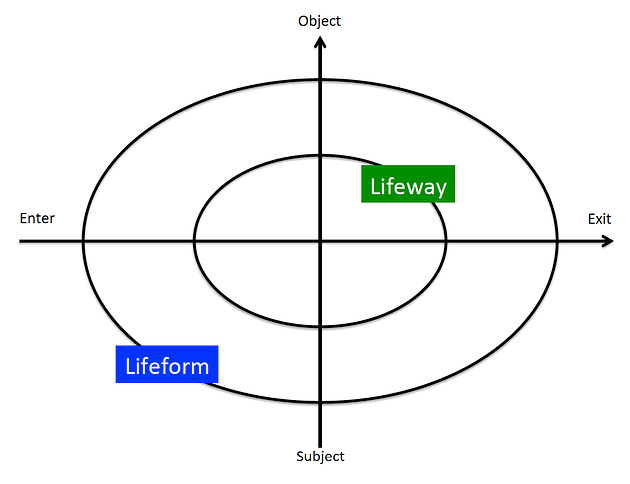
The resulting Lifesystem diagram is created through Diagram Blending, combining a matrix with the Hierarchical Loops. It provides a foundation for developing a new framework for operational-level research.
Diagram Blending
The term Diagram Blending is inspired by the concept of Conceptual Blending. I use Diagram Blending to describe the process of connecting two or more diagrams together.
I am a big fan of Gilles Fauconnier and Mark Turner’s Conceptual Blending Theory, an established approach in cognitive linguistics.
A few years ago, I began studying cognitive linguistics and was immediately fascinated by Conceptual Metaphors and Conceptual Blending. Although Conceptual Blending Theory focuses on linguistic concepts, Fauconnier and Turner developed a set of diagrams to visualize their abstract theoretical ideas.
The diagram on the left above is the basic diagram of Conceptual Blending Theory. The four circles represent four mental spaces: Input Space 1, Input Space 2, Generic Space, and Blend Space. According to the authors,
“Mental spaces are small conceptual packets constructed as we think and talk, for purposes of local understanding and action…A generic mental space maps onto each of the inputs and contains what the inputs have in common.” (2002, pp. 40–42)
The fourth space, the Blended Space, contains emergent structure that is not present in the inputs.
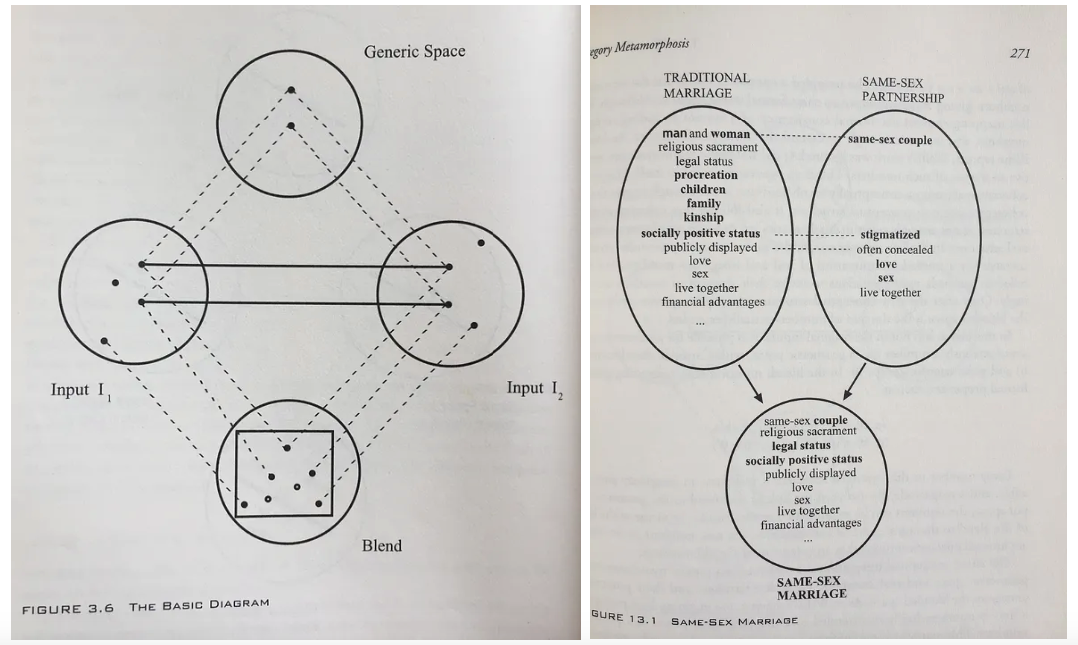
The diagram on the right is a case study of Conceptual Blending. The authors use same-sex marriage to illustrate permanent category change:
“For ‘same-sex marriage,’ the inputs are the traditional scenario of marriage, on the one hand, and an alternative domestic scenario involving two people of the same sex, on the other. The cross-space mapping may link typical elements such as partners, common dwellings, commitment, love, and sex. Selective projection then recruits additional structure from each input. For example, social recognition, wedding ceremonies, and mode of taxation are projected from the input of ‘traditional marriage,’ while same sex, absence of biologically common children, and culturally defined roles of the partners are projected from the other input.” (2002, pp. 269–270)
I was particularly impressed by the way they used diagrams to express complex theoretical ideas. The term “Diagram Blending” is inspired by Conceptual Blending, and I adopt it as a tribute to Fauconnier and Turner.
The main difference between Conceptual Blending and Diagram Blending is this: instead of using four mental spaces as the foundation of a theory, I use the Part–Whole Curativity as the foundation. A simple diagram can be considered a part of a complex diagram. By applying the basic principle of Part and Whole, we can blend diagrams together and even build a network of diagrams.
Moreover, Diagram Blending primarily focuses on spatial cognition, where the organization of space is the end in itself. At the meta-diagram level, meaning emerges from the arrangement and interaction of elements both within and between meta-diagrams, rather than from external concepts or linguistic representations. Each element and each operation among elements contributes to the evolution of the overall spatial structure—such as patterns, hierarchies, and connections—effectively presenting diagramming as a form of thinking.
In contrast, Conceptual Blending operates at the level of conceptual thinking in language, where diagrams and spaces are merely tools to generate meaning for words or concepts. While spatial organization supports understanding, it is not the goal; the ultimate purpose is to create new conceptual meaning by combining and projecting elements across mental spaces.
In this sense, Diagram Blending is not a direct application of Conceptual Blending. Unlike Conceptual Blending, where diagrams serve primarily to visualize conceptual combinations, in Diagram Blending, diagrams are not visualizations of concepts. Instead, they function as spatial structures through which meaning and relationships emerge, allowing the process of diagramming itself to become a medium for thought.
Both concepts and diagrams are tools for thinking, which is inherently complex. I hope that Diagram Blending can provide a simple method to inspire a new practice of diagramming for thought and expression. More details can be found in my 2021 book draft, Diagram Blending: Building Diagram Networks.
Diagram Blending involves compressing multiple spatial relationships from several diagrams into a single, unified diagram. The Lifesystem diagram above is a simple example of this process.
As discussed above, the Tripartness meta-diagram can be seen as the outcome of Diagram Blending applied to three meta-diagrams: Dialectic Room, Interactive Zone, and Hierarchical Loops. This example illustrates how multiple meta-diagrams can be curated into a coherent diagram network, revealing relational patterns and interactions that are not immediately apparent in the individual diagrams.
Such a flexible diagram network mirrors the fluidity of human cognition, supporting creative thinking and the dynamic organization of ideas. Unlike more rigid, single-purpose tools — such as conventional 2×2 matrices — Diagram Blending allows for adaptive curation, helping to trace and explore evolving conceptual relationships rather than confining thought to a fixed heuristic structure.
How to Use the Tripartness Meta-Diagram
The discussion above provides a guide for using the Tripartness meta-diagram. The process can be summarized in the following steps:
- Define your concepts that are relevant to your situational challenges.
2. Use keywords to describe your concepts.
3. Replace the placeholders — Corner, Zone, Center, and Context — with your keywords.
4. Discover themes within each Zone.
5. Expand each Corner using the Dialectical Room diagram.
6. Expand each Zone using the Interactive Zone diagram and/or the Theme U diagram.
7. Expand the concepts “Center–Context” using the Hierarchical Loops diagram.
All of these meta-diagrams are simple enough to draw on paper or cards. For example, I created the following draft using the Dialectic Room on February 27, 2021.
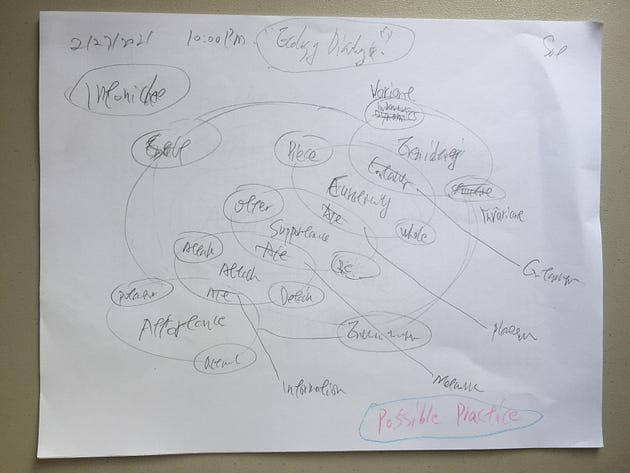
Why did I do it? I wanted to use a single diagram to curate my ideas about the Ecological Practice approach. I had already created a similar diagram for Project-oriented Activity Theory, so I reused the format to organize the Ecological Practice approach.
The diagram below shows the original version of Project-oriented Activity Theory.
However, I did not adopt it for the final diagram. After two months, I designed a new diagram, which became the final version for the third version of the Ecological Practice approach, published on April 26, 2021.
Although I did not ultimately use the ideas inspired by the Dialectical Room meta-diagram, this does not mean they were a failure. Their value lies in helping us explore and reflect on our own conceptual systems. Determining whether a particular line of thought leads to a valid conclusion is a separate question.
I hope you enjoy exploring these meta-diagrams. I will use them to expand the original Strategic Value Proposition diagram in the next article. In fact, this is the main reason I am writing this article.
v1.0 - July 30, 2021
v2.0 - November 14, 2025 - 3,213 words